Friday, July 30, 2010
Monday, July 26, 2010
Up-coming events
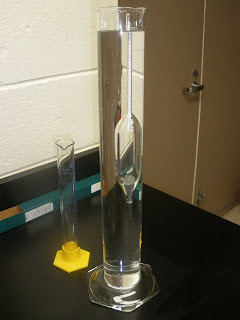
Classifying Snapper Creek Field Site Soil With Hydrometer Texture Test


 After inverting the cylinder the hydrometer is inserted into the cylinder and readings taken at 30 s and 60s. The 30 s and 60 s readings are taken three times by repeating the process. Hydrometer readings are taken at 30 s, 60 s, 90 min, and 24 hours.
 Nicholas' expertise with parafilm kept the sedimentation cylinders sealed tight during shaking...
Tempe cell experiment to determine soil water characteristic curve of Krome soil
 Samples being saturated from the bottom in DI water to which Thymol solution has been added. Samples should be shocked for between 3 days to 1 week. The ceramic plates should be shocked for at least 24 hours.
 Kevin placing a ceramic plate into the bottom of the tempe cell, while Isaya, Tina and Robert watch. This should be done while all the pieces are submerged into a solution.
 There should be no bubbles when looking into the bottom of the tempe cell. When bubbles were noticed, the pieces were re-assembled in solution.
 While keeping the thumb finger on the horse outlet place the bottom of the tempe cell setup on to the core.
 Mike and Isaya happy after successfully assembling a tempe cell after several tries. With some little patience everything works great.
 The cheese cloth was removed from the top of the cell and replaced with a wet paper towel. The setup was then left for 2 days to allow gravity water to drain.
 Securing the tempe cell top on to the core. A good seal is important and o-rings should be greased.
 At each pressure setting, when equilibrium is reached (i.e., no more water drains) we measure the volume of water that has fallen from the tempe to the measuring cylinder. We then use this information in generating the soil water characteristic curve.
 Thursday, July 15, 2010
Something old & something new – installations continue!
.JPG)
With only the grasshoppers to keep us company, the day began at a homeowner property participating in Miami-Dade Extension’s Water Use Efficiency Program. This installation was a complete irrigation retrofit that encompassed the backflow prevention device, the mechanical timer, and the indexing valve.

.JPG)
.JPG)
The second installation was supposed to involve reviving a commercial property research site on well-water that went offline in early 2009. However, when we arrived at the location we learned that the sensor system on a nearby municipal water research site had burned out. This burned sensor had been providing solid water-use data since the summer of 2007. For the remainder of the day, we focused on installing a new sensor on the municipal water site - adding a few equipment flourishes previously overlooked: grease caps to protect wire connections from the elements and a junction box for easy future sensor retrieval or maintenance.

Wednesday, July 14, 2010
REU Florida trip to ENP and Extension Service
Saturday, July 10, 2010
REU presentations
Thursday, July 8, 2010
C-111 project

.JPG)
.JPG)
.JPG)
.JPG)
.JPG)
Tuesday, July 6, 2010
REU travel
Monday, July 5, 2010
Nicholas's 1st dissertation manuscript published
July begins with two new research properties!
The day began with a rain-accompanied top-to-bottom irrigation system retrofit. Keeping only the existing backflow device, we installed the soil water sensor system, electric valves and two water meters. These total retrofits serve not only as an incentive for the homeowner to participate in the study, but also afford me a level of certainty that all zones are running during an irrigation event – something the mechanical indexing valve cannot guarantee.
The day concluded at a property with a pre-existing digital timer and electric zone valve irrigation system. We connected the soil water sensor add-on device to the timer and installed a water meter on each experimental zone.
These properties are now two more stops during my reading days – when I collect data in the field to verify soil water sensors’ water savings potential in urban landscape irrigation.
Friday, July 2, 2010
"Smart" irrigation in Spanish!
.JPG)
.JPG)
http://www.youtube.com/watch?v=cW0TYaplnpk
http://www.youtube.com/watch?v=-GGkin0_oyQ


.JPG)
.JPG)