Last month the field plot study was officially set in motion! With all the plots fertilized, the four treatment timers programmed, sprinkler uniformity tests conducted for all reps, and a lysimeter sampling plan established, three months of work came to fruition and the larger labor of research is now underway. What follows is a summary of the final steps leading to study initiation.
 Go forth and fertilize!
In early September, the field plot was fertilized for the first time using a 26-2-11 (26% N [6.5% slow-release N], 2% P, 11% K) combination.

In accordance with
IFAS recommendations (1 lb N per 1000 sq. ft),
17.8 lbs of the above fertilizer was applied using a
Scotts Standard broadcast spreader.
The spreader was pushed through the middle of each plot (in both parallel and perpendicular directions) at a relatively quick, steady pace.

Analysis of the leachate captured by lysimeters buried in the plots will help indicate which irrigation control device is more likely to contribute to the loss of fertilizer into the groundwater.
 Uniformity: day night/day night
In order to ensure that sprinklers in each treatment rep are covering the rep’s area in a uniform fashion, uniformity tests were conducted for all 16 plots.
Each plot is irrigated with 4
MP 1000 multi-stream spray nozzles (pressure-regulated to 30 psi and restricted to 90° arc) – one at each corner spraying inward. To account for the entire plot, 25 catchments (947 mL plastic containers with a round opening, diameter = 5.25 in) were set up in a uniform grid pattern, 1 ft inset from the outer boundary and equally spaced in each plot.

Tests were conducted for 2 hrs and four plots at a time to avoid excessive pressure loss. Wind speed was monitored every 15 minutes with a handheld anemometer. However, to eliminate wind disturbance and evaporation, tests were run in the evening and early morning.
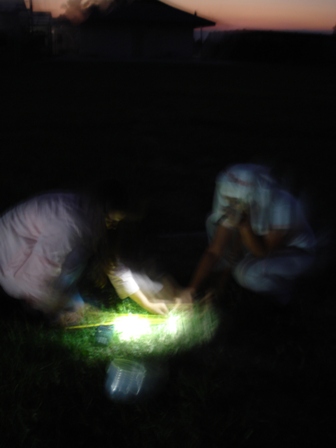
 Manuel & Letty in all-nighter mode
 rotator at sundown
 Science by lantern-light!
 In the best of all possible worlds, the above testing plan translates to 4 runs of 4 and the process is finished! But this is research - which is, if nothing else, fraught with surprises!
Wind speed is monitored in 15 min intervals
After performing 22 uniformity tests (16 plots + 6 re-do’s), all plots passed with acceptable distribution uniformity ratings as set by the
Irrigation Association.

Determining catch can volumes
Getting with the program

The four irrigation treatments in the study are:
1.
Automated schedule (no control device)
4.
Evapotranspiration (ET)-basedThe basis of all treatment programming is that
MP 1000 heads apply water at a rate of 0.5 in/hr. In accordance with
UF recommendations of never irrigating in excess of 0.5 in during an event, the
automated schedule treatment is programmed to run for 1 hr, twice a week - thus also abiding by
Miami-Dade County’s 2 day per week watering restriction.

The soil water sensor treatment is also programmed for one hour twice a week, but its four reps will fire only if the sensor buried in each plot detects moisture below a set threshold (~70% of the volumetric water content at saturation). The sensor threshold was set automatically by saturating the area (at sundown) where the sensor is buried and initiating the automatic threshold feature. 24 hrs later the sensor set a threshold.
The rain sensor treatment is programmed similarly, but the timer will cease to function if and when the sensor catches 0.5 in of water during a rain event.

Unlike the other treatments, the
weather-based controller treatment is not programmed with a set run time. Instead, factors such as sprinkler type, shade factor, and plant type were input. Restricted to two watering days per week and a 1 hr watering window therein, the timer will apply the volume that the above factors in conjunction with the temperature and rainfall information from its on-site weather station deem necessary.
Catch and releaseA lysimeter sampling plan has been established that will span the entire sampling period (September 2011 – January 2012). Every Monday and Thursday, leachate samples are collected from the lysimeters (12) buried in each treatment’s plots.

Beginning with a clean
peristaltic pump (acid-washed and rinsed with DI-water) and clean 250 mL sample bottles, the sampling protocol is as follows:
1. Collect both an equipment and field blank
2. Pump an initial small sample amount from the lysimeter to purge hose of leftover DI-water
3. Collect leachate sample, label bottle appropriately and place it in a field cooler

4. If captured leachate exceeds 250 mL, measure and record remaining volume in graduated cylinder
5. Rinse pump hose between each sampling with ~400 mL DI-water and repeat steps 2-5

Samples are then filtered and frozen for future analysis of
nitrate (NO3),
total nitrogen, and
ammonium (NH4).
Phosphorous testing will only be done for the initial and final round of collected samples. Pre-fertilization and final soil and grass clipping sample analysis will also be performed.
Acknowledgements:
In addition to the
Water Resource Engineering team, visiting student interns Manuel and Letty contributed greatly to the completion of the tasks described above.
Nicole Dobbs
See previous field plot entries:


