
Friday, July 30, 2010
Monday, July 26, 2010
Up-coming events
Just a reminder to everyone that Nic's last day is this week! It will be very sad to see him leave (no tears!). Also - next Monday Liliana and Kevin will present their research findings for the summer. Presentations will be at 10am. I will post an announcement soon. L and K's last day will be next Tuesday and they will depart on Wednesday. It has been great having them here and we will miss them also! It is very nice to have young, energetic people to inspire us.
Classifying Snapper Creek Field Site Soil With Hydrometer Texture Test

For comparison to data collected from a tempe cell analysis, knowledge of a soils texture can give insight into the correct soil moisture curve for a specific soil.
The Snapper Creek field site soil was analysed for %Organic Matter, %Gravel, and %Sand, Silt, and Clay Content.

Soil Samples were collected at the Snapper Creek Field Site for analysis.
The organic matter of the soil was determined through the Loss on Ignition method. Three 5 gram samples were placed in dried crucibles and heated in the Muffle for 12 hours at 105 deg C. The weight was recorded, then the samples were heated for 12 hours at 500 deg C. The difference in weight between the sample at 105 deg C and 500 deg C is the organic matter content of the soil.
The organic matter of the Snapper Creek Site was 7.89%
The soil sample was split in two using a No. 10 (2mm) sieve to seperate the large and small particles. The particles greater than 2mm in diameter are gravel. The (mass of dry gravel) / (mass of dry gravel + mass of dry small particles) was used to calculate the % gravel content of the soil.
The gravel content of the Snapper Creek Site was 19.12%
To determine the % sand, silt, and clay a texture test was completed using a hydrometer.
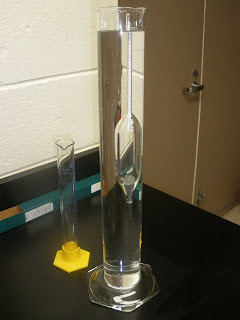
A hydrometer is an instrument that measures the specific gravity of a solution. Using a hydrometer to analyze soil texture is possible because of the principle of Stokes Law. Stokes Law states that particles of different sizes will fall at different rates in solution. By taking hydrometer readings at various times we can determine the size of the particles still in solution at that time.
Prior to starting the hydrometer test three 60 g soil samples were shaken over night in a 40 g/L Sodium Hexametaphosphate solution. The purpose of this solution is a dispersant, breaking up all of the clumped soil particles.
The soil samples were added to the sedimentation cylinders and filled to 1000 mL with DI water. One blank cylinder of DI water and dispersant solution was used to correct for variation in test conditions.

Prior to taking hydrometer readings the sedimentation cylinder is inverted for one minute to force all particles into solution.
 After inverting the cylinder the hydrometer is inserted into the cylinder and readings taken at 30 s and 60s. The 30 s and 60 s readings are taken three times by repeating the process. Hydrometer readings are taken at 30 s, 60 s, 90 min, and 24 hours.
The % sand, silt, and clay content is determined through equations relating the hydrometer readings to the desired parameters.
The Snapper Creek Soil was 63.25% Sand, 23.43% Silt, and 13.33% Clay, receiving the classification of a Sandy Loam.
Soil texture can be empirically related to soil water characteristics using equations developed in Saxton 1986 and Saxton 2006.
 Nicholas' expertise with parafilm kept the sedimentation cylinders sealed tight during shaking...
...The roof of the lab was not so lucky, as Tropical Storm Bonnie raged through TREC during the hydrometer test!
-Kevin
Tempe cell experiment to determine soil water characteristic curve of Krome soil
 Samples being saturated from the bottom in DI water to which Thymol solution has been added. Samples should be shocked for between 3 days to 1 week. The ceramic plates should be shocked for at least 24 hours.
 Kevin placing a ceramic plate into the bottom of the tempe cell, while Isaya, Tina and Robert watch. This should be done while all the pieces are submerged into a solution.
 There should be no bubbles when looking into the bottom of the tempe cell. When bubbles were noticed, the pieces were re-assembled in solution.
 While keeping the thumb finger on the horse outlet place the bottom of the tempe cell setup on to the core.
 Mike and Isaya happy after successfully assembling a tempe cell after several tries. With some little patience everything works great.
 The cheese cloth was removed from the top of the cell and replaced with a wet paper towel. The setup was then left for 2 days to allow gravity water to drain.
 Securing the tempe cell top on to the core. A good seal is important and o-rings should be greased.
Pressure regulators are used in adjusting pressures to the required settings. Water manometer is used for low pressure while the mercury manometer is used for high pressure. The tempe cell setup in our lab is designed for maximum pressures of 1 bar.
 At each pressure setting, when equilibrium is reached (i.e., no more water drains) we measure the volume of water that has fallen from the tempe to the measuring cylinder. We then use this information in generating the soil water characteristic curve.
 Thursday, July 15, 2010
Something old & something new – installations continue!
This week, one new research site was added to the WUEP pair-wise study and an older site was reinstalled.
.JPG)
With only the grasshoppers to keep us company, the day began at a homeowner property participating in Miami-Dade Extension’s Water Use Efficiency Program. This installation was a complete irrigation retrofit that encompassed the backflow prevention device, the mechanical timer, and the indexing valve.

.JPG)
.JPG)
The second installation was supposed to involve reviving a commercial property research site on well-water that went offline in early 2009. However, when we arrived at the location we learned that the sensor system on a nearby municipal water research site had burned out. This burned sensor had been providing solid water-use data since the summer of 2007. For the remainder of the day, we focused on installing a new sensor on the municipal water site - adding a few equipment flourishes previously overlooked: grease caps to protect wire connections from the elements and a junction box for easy future sensor retrieval or maintenance.

With only the grasshoppers to keep us company, the day began at a homeowner property participating in Miami-Dade Extension’s Water Use Efficiency Program. This installation was a complete irrigation retrofit that encompassed the backflow prevention device, the mechanical timer, and the indexing valve.
In the rain, we installed an anti-siphon valve with emergency shut-off option, the soil moisture sensor system, electric valves, and a water meter on each of the two experimental zones.
The second installation was supposed to involve reviving a commercial property research site on well-water that went offline in early 2009. However, when we arrived at the location we learned that the sensor system on a nearby municipal water research site had burned out. This burned sensor had been providing solid water-use data since the summer of 2007. For the remainder of the day, we focused on installing a new sensor on the municipal water site - adding a few equipment flourishes previously overlooked: grease caps to protect wire connections from the elements and a junction box for easy future sensor retrieval or maintenance.
Stay tuned for the next installation: large commercial property, soil moisture sensor add-on device, and a well-water irrigation system!
Wednesday, July 14, 2010
REU Florida trip to ENP and Extension Service


Yesterday the 2010 NSF REU group visited Homestead. Here are a couple of pics from the event. The students participated in an extension BMP training and visited the Everglades National Park.
Saturday, July 10, 2010
REU presentations
Please congratulate Kevin and Liliana on a great job during the mid-project presentations! They did a really good job!
Thursday, July 8, 2010
C-111 project

The C-111 projected was officially kicked off on June 24 2010 and work has already started. We are all excited about this project. The project involves assessing the impact of raising stage in canal C-111 on soil water dynamics and changes in groundwater table elevation in farmlands adjacent to the eastern boundary of the Everglades National Park commonly known as the Redlands. On the side is a picture showing depth to the bedrock from our field trip yesterday (July-07-2010).
The picture below shows collection of an undisturbed soil sample at site A1K. Soil samples collected from this site will be used in the laboratory determination of soil water characteristic curve for Krome soil.
.JPG)
Below is a collection of an undisturbed soil sample from A1K on July 07 2010.
.JPG)
.JPG)
.JPG)
Soil samples covered with cheese cloth ready for transportation to the laboratory.
.JPG)
Tuesday, July 6, 2010
REU travel
This is a reminder that I will be out with the REU students starting after lunch on July 8th and returning late July 9th. See everyone on Monday the 12th!
Monday, July 5, 2010
Nicholas's 1st dissertation manuscript published
Group! Please congratulate Nicholas for having his manuscript accepted for publication in the Vadose Zone Journal. A great accomplishment! Congratulation Nicholas!
July begins with two new research properties!
Last week, two additional homeowner properties, participating in Miami-Dade Extension’s Water-Use Efficiency Program, elected to take part in the pair-wise study.

The day began with a rain-accompanied top-to-bottom irrigation system retrofit. Keeping only the existing backflow device, we installed the soil water sensor system, electric valves and two water meters. These total retrofits serve not only as an incentive for the homeowner to participate in the study, but also afford me a level of certainty that all zones are running during an irrigation event – something the mechanical indexing valve cannot guarantee.

The day concluded at a property with a pre-existing digital timer and electric zone valve irrigation system. We connected the soil water sensor add-on device to the timer and installed a water meter on each experimental zone..JPG)
These properties are now two more stops during my reading days – when I collect data in the field to verify soil water sensors’ water savings potential in urban landscape irrigation..JPG)
Friday, July 2, 2010
"Smart" irrigation in Spanish!
This week I produced a video for the Urban Conservation Unit team at Miami-Dade Extension.
.JPG)
.JPG)
This video discusses on-site "smart" irrigation controllers. This kind of irrigation timer uses detailed irrigation zone information as well as information gathered from its own weather sensor to estimate evapotranspiration and replenish the landscape as needed.
The video features UCU team member Jesus Lomeli and is in Spanish for the Spanish-speaking, irrigation-loving legions here and beyond.
Check it out:
http://www.youtube.com/watch?v=cW0TYaplnpk
http://www.youtube.com/watch?v=cW0TYaplnpk
The older English version, featuring UCU team leader Mary McCready can be found here:
http://www.youtube.com/watch?v=-GGkin0_oyQ
http://www.youtube.com/watch?v=-GGkin0_oyQ
Subscribe to:
Posts (Atom)